AIPerf
- AIPerf 的定位。
- 安装、基本使用和输出。
- 示例:性能测试与报告解读。
1. 定位
AIPerf 是一款综合性的基准测试工具,用于衡量生成式 AI 服务的性能。它通过命令行显示提供详细的指标,并生成全面的基准测试性能报告。
具有以下 特点:
- 可扩展的多进程架构,支持 9 个服务通过 ZMQ 通信
- 3 种 UI 模式:仪表盘(实时 TUI)、简洁模式(进度条)、无头模式
- 多种基准测试模式:并发性、请求速率、最大并发性请求速率、跟踪回放
- 可扩展的插件系统,支持端点、数据集、传输协议和指标
- 支持公共数据集,包括 ShareGPT 和自定义格式
支持的 API 包括:
- OpenAI chat completions, completions, embeddings, audio, images
- NIM embeddings, rankings
2. 安装与使用
2.1 安装
可以使用 astral/uv 进行工具的全局安装
uv tool install aiperf --default-index https://pypi.tuna.tsinghua.edu.cn/simple
2.2 使用
2.2.1 profile 命令
profile 命令是 AIPerf 的核心,它的基本形式是:
aiperf profile \
  --url <server-url> \
  --model <model-name> \
  --api-key <> \
  --endpoint-type chat \
  --streaming \
  --output-artifact-dir <str>
2.2.2 profile 命令常用参数
| 参数 | 作用 |
|---|---|
--url | 推理服务 base URL,例如 localhost:8000 |
--model | 要压测的模型名,需要和服务端暴露的模型名一致 |
--endpoint-type | 接口类型,Chat Completions 一般用 chat |
--endpoint | 自定义 endpoint path,例如 /v1/chat/completions |
--api-key | 访问需要鉴权的服务 |
--streaming | 启用流式响应,用于测 TTFT / ITL |
--concurrency | 并发数量 |
--request-rate | 目标请求速率(每秒请求数)。 |
--request-count | 总请求数 |
--benchmark-duration | 按时间运行压测 |
--isl | 合成输入 token 长度均值 |
--osl | 期望输出 token 长度均值 |
--public-dataset | 使用内置公共数据集,例如 sharegpt |
--input-file | 使用自定义数据集或 trace |
--extra-inputs | 给请求 payload 增加额外参数,例如 temperature |
--tokenizer | HuggingFace 分词器标识符、本地路径或内置值,用于提示和响应中的词元计数。 |
--use-server-token-count | 用服务器从 API 使用情况字段中报告的词元计数,而不是客户端词元化。 |
--output-artifact-dir | 输出目录,包含所有基准测试工件,包括指标(.csv、.json、.jsonl)、原始数据(_raw.jsonl)、GPU 遥测数据(_gpu_telemetry.jsonl)和时间切片指标(_timeslices.csv/json)。 |
2.2.3 其它命令
除了 profile 命令,AIPerf 还有一些其它命令和功能
| 命令 | 功能 |
|---|---|
--install-completion | 为该应用程序安装 shell 补全功能。 |
analyze-trace | 分析 mooncake 跟踪文件中的 ISL/OSL 分布和缓存命中率。 |
plot | 利用 AIPerf 分析数据生成可视化图表。 |
plugins | 探索 AIPerf 插件:aiperf 插件 [类别] [类型] |
service | 在单个进程中运行 AIPerf 服务。 |
2.3 输出
任务运行中会显示任务进度和详细信息。
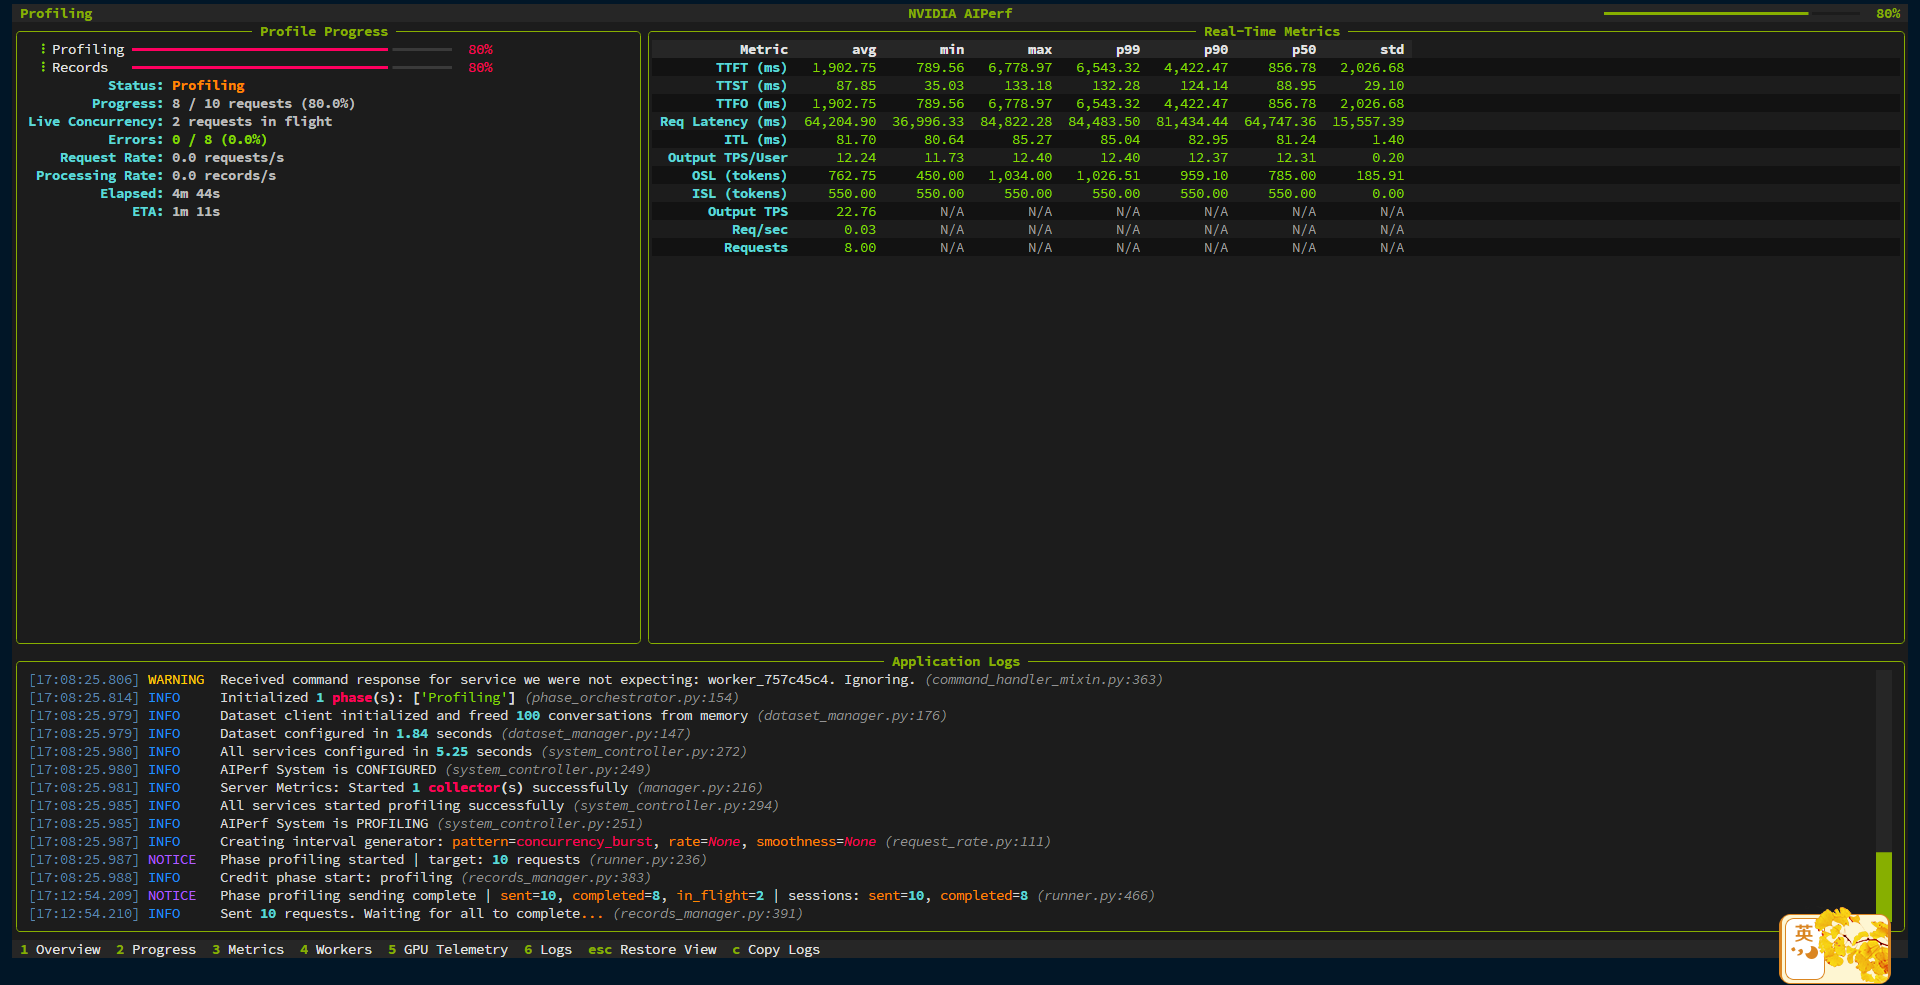
任务运行完成后会输出 Metrics 表格,并且生成 CSV, JSON, Log 文件格式的报告。
3. 性能指标
3.1 指标与含义
| Metrics | 含义 | 示例值 | 备注 |
|---|---|---|---|
| Time to First Token (TTFT) | 从请求发出到收到第一个输出 token的时间 | 842.25 ms | 越低越好 |
| Time to Second Token | 从请求发出到收到第二个输出 token的时间 | 81.62 ms | 辅助判断首 token 之后是否顺畅 |
| Time to First Output Token | 从请求发出到收到第一个输出 token的时间 | 842.25 ms | 与 TTFT 在这组数据里相同 |
| Request Latency | 单个请求从发出到完整结束的总耗时 | 67,367.31 ms | 受输出长度影响大 |
| Inter Token Latency (ITL) | 相邻两个输出 token 之间的平均间隔 | 81.09 ms | 越低越好,反映持续生成速度 |
| Output Token Throughput Per User | 单个用户视角下的输出 token 生成速率 | 12.33 tokens/sec/user | 越高越好,适合衡量单路体验 |
| Output Sequence Length | 单次请求平均输出 token 数 | 838 tokens | 输出越长,请求总时长通常越高 |
| Input Sequence Length | 单次请求输入 token 数 | 550 tokens | |
| Output Token Throughput | 整体输出 token 吞吐率 | 23.46 tokens/sec | 更偏系统整体吞吐,而非单用户体验 |
| Request Throughput | 系统每秒处理完成的请求数 | 0.03 requests/sec | 与请求长短、并发数都有关 |
| Request Count | 本次测试的总请求数 | 10 | 样本量较小,结果波动可能偏大 |
其中:
- 看交互体验,优先关注 TTFT 和 ITL。
- 看服务容量,优先关注 token throughput 和 request throughput。
- 看高并发稳定性,关注 p50 / p90 / p99 latency,以及失败请求。
3.2 数据与解读示例
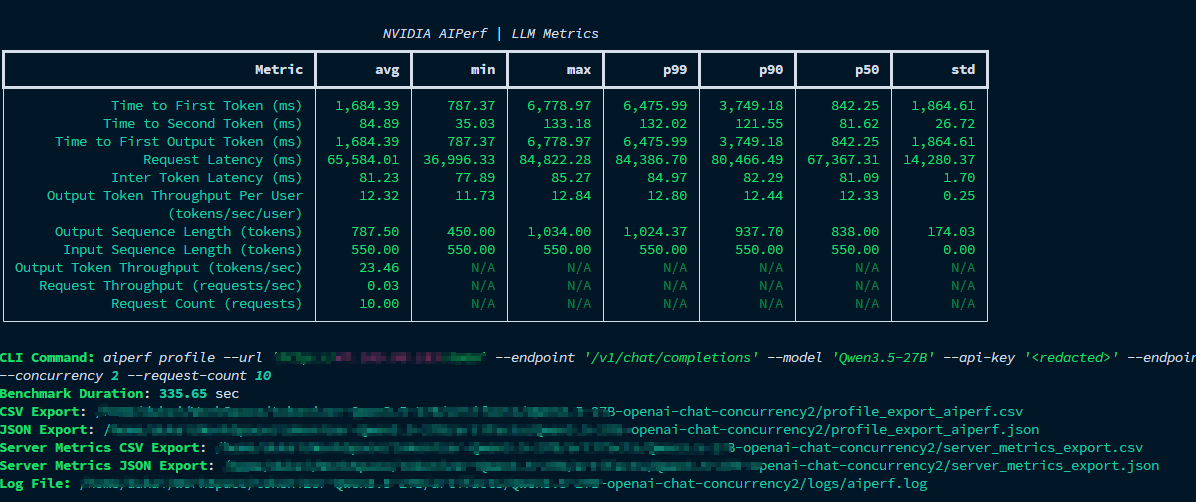
假设我们在压测后,获取了下面的 Metrics 表格
                                                NVIDIA AIPerf | LLM Metrics
┏━━━━━━━━━━━━━━━━━━━━━━━━━━━━━━━━━━━━━━┳━━━━━━━━━━━┳━━━━━━━━━━━┳━━━━━━━━━━━┳━━━━━━━━━━━┳━━━━━━━━━━━┳━━━━━━━━━━━┳━━━━━━━━━━━┓
┃                               Metric ┃       avg ┃       min ┃       max ┃       p99 ┃       p90 ┃       p50 ┃       std ┃
┡━━━━━━━━━━━━━━━━━━━━━━━━━━━━━━━━━━━━━━╇━━━━━━━━━━━╇━━━━━━━━━━━╇━━━━━━━━━━━╇━━━━━━━━━━━╇━━━━━━━━━━━╇━━━━━━━━━━━╇━━━━━━━━━━━┩
│             Time to First Token (ms) │  1,684.39 │    787.37 │  6,778.97 │  6,475.99 │  3,749.18 │    842.25 │  1,864.61 │
│            Time to Second Token (ms) │     84.89 │     35.03 │    133.18 │    132.02 │    121.55 │     81.62 │     26.72 │
│      Time to First Output Token (ms) │  1,684.39 │    787.37 │  6,778.97 │  6,475.99 │  3,749.18 │    842.25 │  1,864.61 │
│                 Request Latency (ms) │ 65,584.01 │ 36,996.33 │ 84,822.28 │ 84,386.70 │ 80,466.49 │ 67,367.31 │ 14,280.37 │
│             Inter Token Latency (ms) │     81.23 │     77.89 │     85.27 │     84.97 │     82.29 │     81.09 │      1.70 │
│     Output Token Throughput Per User │     12.32 │     11.73 │     12.84 │     12.80 │     12.44 │     12.33 │      0.25 │
│                    (tokens/sec/user) │           │           │           │           │           │           │           │
│      Output Sequence Length (tokens) │    787.50 │    450.00 │  1,034.00 │  1,024.37 │    937.70 │    838.00 │    174.03 │
│       Input Sequence Length (tokens) │    550.00 │    550.00 │    550.00 │    550.00 │    550.00 │    550.00 │      0.00 │
│ Output Token Throughput (tokens/sec) │     23.46 │       N/A │       N/A │       N/A │       N/A │       N/A │       N/A │
│    Request Throughput (requests/sec) │      0.03 │       N/A │       N/A │       N/A │       N/A │       N/A │       N/A │
│             Request Count (requests) │     10.00 │       N/A │       N/A │       N/A │       N/A │       N/A │       N/A │
└──────────────────────────────────────┴───────────┴───────────┴───────────┴───────────┴───────────┴───────────┴───────────┘
可以看出来
| 依据的指标与数据 | 结论 | 解读 |
|---|---|---|
| Time to First Token (TTFT) | 首 token 中位数尚可,但尾延迟较差 | 一半请求能在 1 秒内开始输出,体感尚可;但少数请求首字等待明显偏长,首字稳定性不足。 |
| Inter Token Latency (ITL), Output Token Throughput Per User | 一旦开始生成,后续解码比较稳定 | 主要问题不在 decode 阶段,而在首 token 之前的 prefill、排队或调度。 |
| Time to Second Token | 第二个 token 很快接上,流式输出节奏正常 | 第一个 token 出来后,后续 token 基本能按稳定节奏持续输出。 |
| Request Latency, Output Sequence Length, Output Token Throughput Per User | 单请求总耗时很长,主要受输出长度影响 | 生成内容本身很长,因此整体请求耗时被拉高,并不完全是服务异常变慢。 |
| Output Token Throughput Per User | 单用户生成速度中等,谈不上快 | 对 27B 级模型来说属于可用水平,但离“交互丝滑”还有差距。 |
| Output Token Throughput, Request Throughput | 系统整体吞吐偏低 | 这套服务更适合长回答、低并发场景,不适合高并发高吞吐问答。 |
| Time to First Token (TTFT), Inter Token Latency (ITL) | 首 token 抖动远大于后续 token 抖动 | 性能波动集中在请求开始阶段,而不是持续生成阶段。 |
| Time to First Token (TTFT), Time to Second Token, Inter Token Latency (ITL) | 当前体验更像“首字不稳,出字后稳定” | 用户感知会是:有时候很快开始,有时候要等很久;但一旦开始,输出过程较平顺。 |
| Request Count | 样本量偏小,结论可参考但不够扎实 | 可以先作为趋势判断,但若要正式评估,建议扩大请求数并测试更多并发档位。 |
| Time to First Token (TTFT), Inter Token Latency (ITL), Output Token Throughput Per User | 优化方向应优先关注 TTFT,而不是 decode | 应优先排查 prefill、调度排队、冷启动、多模态前处理、prefix cache / KV cache 命中情况。 |
总结:这套性能属于“生成阶段稳定,但首 token 长尾明显,整体请求时间又被长输出拉长”的状态。
4. 使用示例
4.1 压测 vLLM OpenAI-compatible 服务
先启动一个 vLLM 服务:
docker pull vllm/vllm-openai:latest

docker run --gpus all -p 8000:8000 vllm/vllm-openai:latest \
  --model Qwen/Qwen3-0.6B \
  --reasoning-parser qwen3 \
  --host 0.0.0.0 \
  --port 8000
检查服务是否可用:
curl http://localhost:8000/v1/chat/completions \
  -H "Content-Type: application/json" \
  -d '{
    "model": "Qwen/Qwen3-0.6B",
    "messages": [{"role": "user", "content": "test"}],
    "max_tokens": 1
  }'
用 AIPerf 压测:
aiperf profile \
  --model Qwen/Qwen3-0.6B \
  --endpoint-type chat \
  --endpoint /v1/chat/completions \
  --streaming \
  --request-rate 32 \
  --request-count 64 \
  --url localhost:8000
这个例子表示:
- 请求目标是本机
localhost:8000。 - 使用 Chat Completions 接口
/v1/chat/completions。 - 开启 streaming,因此可以测 TTFT / ITL。
- 按
32 req/s的请求速率发起请求。 - 总共发
64个请求。
适合用来快速判断某个 vLLM 服务在指定请求速率下是否扛得住。
4.2 固定并发压测
如果想看固定并发下的表现,可以用 --concurrency:
aiperf profile \
  --model Qwen/Qwen3-0.6B \
  --url localhost:8000 \
  --endpoint-type chat \
  --endpoint /v1/chat/completions \
  --streaming \
  --concurrency 10 \
  --request-count 100
这个例子表示:
- 保持 10 个并发请求。
- 总共完成 100 个请求。
- 观察 p50 / p90 / p99 延迟、TTFT、ITL 和吞吐。
适合回答“这个服务在 10 并发下表现如何”。
4.3 按请求速率压测
如果想模拟线上流量入口,可以用 --request-rate:
aiperf profile \
  --model Qwen/Qwen3-0.6B \
  --url localhost:8000 \
  --endpoint-type chat \
  --endpoint /v1/chat/completions \
  --streaming \
  --request-rate 5.0 \
  --benchmark-duration 60
这个例子表示:
- 以约
5 req/s的请求速率发起请求。 - 持续运行 60 秒。
- 更适合模拟稳定流量,而不是固定并发。
4.4 控制输入和输出 token 长度
AIPerf 可以生成合成请求,并控制输入长度和输出长度。
aiperf profile \
  --model Qwen/Qwen3-0.6B \
  --url localhost:8000 \
  --endpoint-type chat \
  --endpoint /v1/chat/completions \
  --streaming \
  --concurrency 4 \
  --request-count 50 \
  --isl 1024 \
  --osl 256
这个例子适合测试较长输入、固定输出长度下的性能。
注意:
--isl是合成输入 token 长度均值。--osl是期望输出 token 长度均值。- 长输入会增加 prefill 压力。
- 长输出会增加 decode 压力。
4.5 使用公共数据集
AIPerf 支持一些内置公共数据集,例如 sharegpt。
aiperf profile \
  --model Qwen/Qwen3-0.6B \
  --url localhost:8000 \
  --endpoint-type chat \
  --endpoint /v1/chat/completions \
  --streaming \
  --public-dataset sharegpt \
  --num-sessions 50
这个例子更接近真实对话分布,适合做模型服务的实际体验型压测。
4.6 压测 Ollama 服务
官方 README 里也给了 Ollama 的快速示例。先启动 Ollama 并拉取模型:
docker run -d \
  --name ollama \
  -p 11434:11434 \
  -v ollama-data:/root/.ollama \
  ollama/ollama:latest

docker exec -it ollama ollama pull granite4:350m
然后运行 AIPerf:
aiperf profile \
  --model "granite4:350m" \
  --streaming \
  --endpoint-type chat \
  --tokenizer ibm-granite/granite-4.0-micro \
  --url http://localhost:11434
这里显式指定 --tokenizer,是为了让 AIPerf 能计算输入/输出 token 相关指标。
5. 使用技巧
-
模型名必须和服务端暴露的模型名一致,否则请求会失败。
-
--url是 base URL,--endpoint-type chat默认会使用 OpenAI-compatible 的 chat completions 路径;如果服务路径不标准,再用--endpoint显式指定。 -
开启
--streaming才能更好地测 TTFT 和 ITL。 -
如果服务端不返回 usage token 数,可以考虑使用 tokenizer 或
--use-server-token-count相关策略,但要确认服务端是否支持 usage 字段。 -
压测时要区分固定并发和固定请求速率:前者看并发承载,后者更像线上流量到达模式。
-
结果不要只看平均值,p90 / p99 更容易暴露排队、抖动和尾延迟问题。
-
使用公共数据集或自定义 trace 时,要确认数据分布和真实业务相似,否则压测结果只能作为参考。
-
如果任务运行时 报了跟 tokenizer 有关的错误,可以去 HuggingFace 上下载模型对应的 tokenizer 配置,包括下面的几个文件:
config.jsontokenizer.jsontokenizer_config.jsonvocab.json
然后在命令中使用
--tokenizer手动指定一下 tokenizer 目录的位置